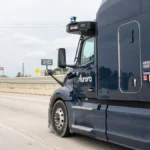
The American trucking industry is currently experiencing a paradox. Across the nation, carriers are witnessing a palpable surge in freight movement, with the FreightWaves SONAR National Truckload Index (NTI.USA) reporting dry van spot rates up more than 20% year-over-year as of mid-May 2026. For small carriers who have endured three years of a grinding freight recession, this activity feels like the long-awaited arrival of a market recovery.
However, industry analysts and macroeconomic data suggest otherwise. This spike is not the result of an organic economic expansion; it is the consequence of a massive, industry-wide "front-loading" effort. Shippers, desperate to mitigate the impact of impending tariff escalations on goods from China, Mexico, and Canada, are pulling inventory forward at an unprecedented pace. While the revenue on the table is real, the structural foundation of this surge is fragile, creating a "boom-bust" cycle that threatens to leave unprepared operators in a precarious financial position.
A Chronology of the Tariff Rush
The current freight environment is a direct evolution of the protectionist trade policies that have characterized the last eighteen months. In early 2025, the initial wave of reciprocal tariff packages triggered a similar, albeit shorter, spike in volume. Data from the SONAR Truckload Volume Index (STVI.USA) during that period shows a clear pattern: a sharp, aggressive climb in activity as inventory was pulled forward, followed by a swift "hangover" as warehouses hit capacity and new order volume decelerated.
By late April 2026, as rumors and legislative drafts concerning further tariff escalations began to circulate, the cycle restarted. Importers, acting on the lessons of 2025, initiated a coordinated effort to secure shipping capacity before new duties could be locked in. This created an immediate, artificial tightening of the market. Unlike a natural recovery—which is usually driven by consumer demand and manufacturing output—this surge is driven by a race against a bureaucratic clock. Once the deadline for these tariff adjustments passes, or once warehouse capacity is fully saturated, the current demand is projected to dissipate as rapidly as it appeared.
Supporting Data: By the Numbers
The depth of this surge is reflected in the technical indicators monitored by FreightWaves and other logistics intelligence firms:
- Flatbed Volume: The SONAR Flatbed Index (FTI.USA) is currently running nearly 50% above year-ago levels. This is largely attributed to the intersection of infrastructure spending and the reshoring of manufacturing, which has placed significant pressure on a diminished supply of flatbed equipment.
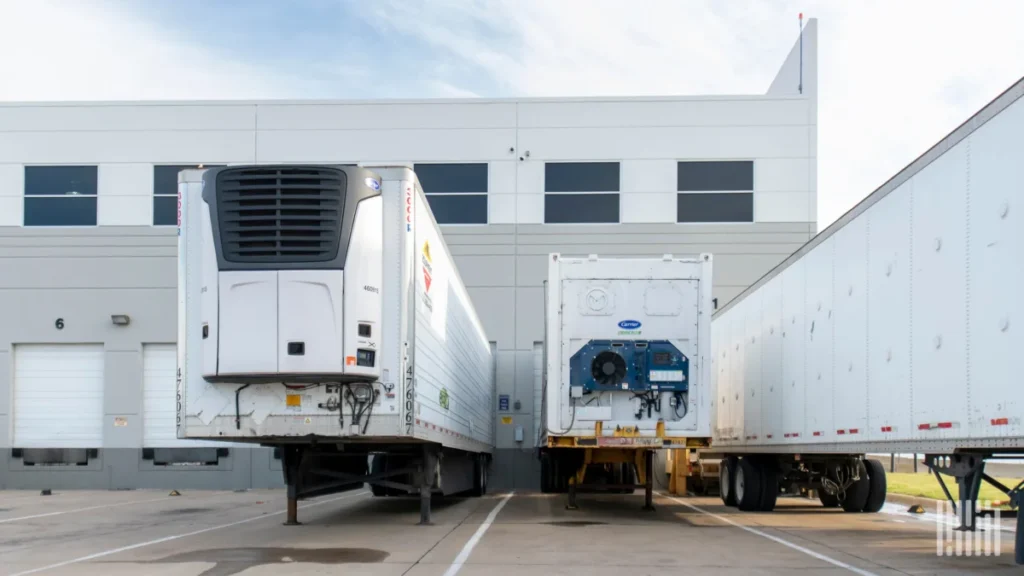
- Reefer Tightness: The SONAR Reefer Index (RTI.USA) confirms a parallel tightening, with rate gains mirroring those of the dry van sector, compounded by the seasonal arrival of produce season.
- Tender Rejections: The SONAR Outbound Tender Rejection Index (STRI.USA) is hovering near 14%. Historically, any level above 7% to 8% signals sustained upward pressure on spot pricing. We have not seen these levels consistently since the post-COVID supply chain unwind of 2022.
- Fuel Costs: The U.S. Energy Information Administration reported diesel at $5.64 per gallon for the week of May 4, 2026, a 54% increase from the $3.65 reported a year prior.
Official Perspectives and Expert Analysis
Industry voices are urging caution amidst the excitement. Tim Denoyer, Vice President and Senior Analyst at ACT Research, has highlighted that international trade accounts for roughly 16% to 25% of U.S. surface freight volume. When such a significant segment of the market is subject to volatility, the ripple effects are unavoidable.
The Owner-Operator Independent Drivers Association (OOIDA) has publicly stated that these tariffs possess the "potential to inhibit the recovery from a freight recession that has been acutely felt by America’s small-business truckers." Their concern is rooted in the "margin compression" effect: while rates are up, the cost of participating in this market—from fuel to equipment maintenance—has risen at a disproportionate rate.
Furthermore, Carter Vieth, a Research Analyst at ACT Research, points to a 24% month-over-month decline in Class 8 net orders for April 2026. This contraction, masked by favorable year-over-year comparisons to the 2025 "Liberation Day" comps, suggests that fleets are not necessarily confident in long-term expansion, despite the current high-revenue environment.
The Structural Implications for Carriers
The most dangerous element of this cycle is the "Rate-to-Cash Gap." Carriers who book loads at $2.00 per mile are seeing the revenue, but they are not seeing the cash for 30 to 45 days. In an environment where diesel costs are 54% higher than last year, the cash flow strain is immense.
The Maintenance Trap
Beyond the daily operational costs, the "Steel and Parts Problem" is exerting long-term pressure. With Section 232 tariffs on steel and aluminum derivatives sitting at 50%, the cost of essential maintenance—chassis components, frame repairs, and engine parts—has surged. ACT Research projects that Class 8 truck prices will increase by $10,000 per unit in 2026 due to these tariffs. Small fleets running on tight margins are finding that an unexpected repair can wipe out the profits of an entire month of "peak" freight, especially when that profit is trapped in the 30-day payment cycle.
The Cost of Accessing Capital
Many carriers are relying on factoring and quick-pay options to bridge the gap between delivery and payment. However, these services come with a cost. A 3% quick-pay fee on a 10-day advance, when annualized, results in an effective cost of capital of approximately 36%. For a carrier operating five trucks, this can equate to $8,400 per month in "hidden" fees. This is not merely a service charge; it is a significant drag on take-home margin that can be the difference between survival and insolvency when the market inevitably corrects.
Strategies for Survival: Navigating the Boom-Bust Cycle
For the owner-operator or the small fleet manager, the next 60 days are critical. The current market requires a shift from "growth mode" to "defensive cash management."
For the Solo Operator
- Calculate True Break-Even: Do not base your profitability on linehaul rates alone. With fuel costs at $5.64 per gallon, an operator getting 7.5 miles per gallon is spending $0.75 per mile on fuel alone. With insurance, debt service, and maintenance, many operators have a break-even point between $1.65 and $1.90. If you aren’t clearing that, you are losing money on every mile.
- Avoid Factoring Habituation: Use factoring only when necessary to avoid missing critical payments. Do not treat it as a standard business expense.
- Build a Buffer: Before taking on new equipment or debt, ensure you have a 30-day operating cash reserve.
For the Fleet Operator (5–20 Trucks)
- Stress-Test Your Debt: If you are considering adding capacity, ensure the debt service remains viable at a $1.75 linehaul rate. If your business model only functions at the current $2.00+ peak, you are underwriting your fleet against a temporary market condition.
- Rolling Projections: Implement a 45-day rolling cash flow projection. You must be able to see the gap between invoiced revenue and cleared cash to prevent liquidity crises.
- Direct Relationships: Use the current leverage to pivot toward direct shipper relationships. A shipper scrambling for capacity in May is more likely to sign a contract than they were when the market was soft.
Conclusion: Preparing for the Correction
The "surge, absorb, drop" pattern is a well-documented phenomenon in freight economics. The current front-loading is effectively "borrowing" future freight volume and bringing it into the present. Once the inventory is moved and the warehouses are full, the inevitable correction will occur.
Carriers who mistake this temporary tariff-induced peak for a permanent market recovery are at risk of over-leveraging, over-buying, and ultimately, running out of runway. The key to surviving the coming months is not just moving more freight—it is understanding that in a volatile market, the most successful carrier is the one with the highest cash liquidity and the most disciplined approach to cost control. Do not let the sound of a busy load board drown out the reality of your balance sheet.